 `
`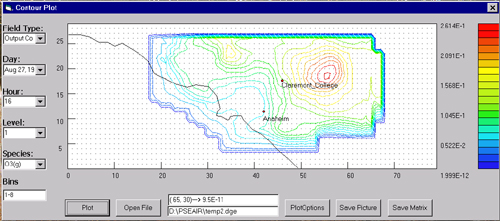
After all modifications are made by scaling and such, the user saves the file and executes the CIT Airshed program from the File menu. After the program finished execution (18 minutes for gas phase and 1 day for aerosol on PII 233), the user can view the output form a simple contour program. The Figure above shows such a contour of ozone resulting from the CIT Airshed Program. The user can view all the input fields of CIT Airshed Program and bserved data also.
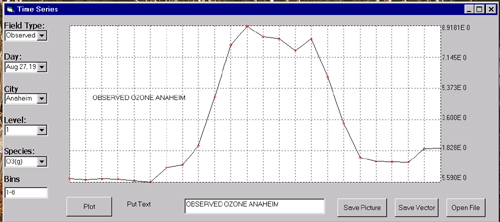
The user can view time series plot also. A time series plot is a plot of values at a particular location varied through time. The above figure shows the bserved ozone concentration for Anaheim on Aug 27 1987.
 `
`
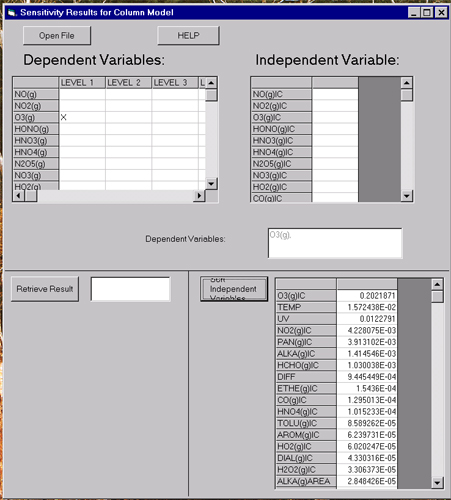
An interesting feature of the PSE Airshed program is the newly developed sensitivity model. The sensitivity model analyzes behavoir of species in a column of air. The sensivity model can answer in detail questions like, "On a column of air, what is most important to ozone formation." Not only does the model tells what is most important, it tells how much. The figure above shows a sample of the output of a simulation where the species are under chemical reactions, aerosol dynamics, depositions, vertical transport and emissions for 30 minutes. It seems that the most important contribution to ozone is how much ozone was there initially, then by temperature, by ultra violet radiation, and how much NO2 was there initially, etc. Note that ozone concentration after 30 minutes depends on how much ozone was there initially by the sensivity of 0.202. This means, if the initial ozone concentration was increased by 1ppb then the resulting change in ozone after 30 minutes is only 0.202!
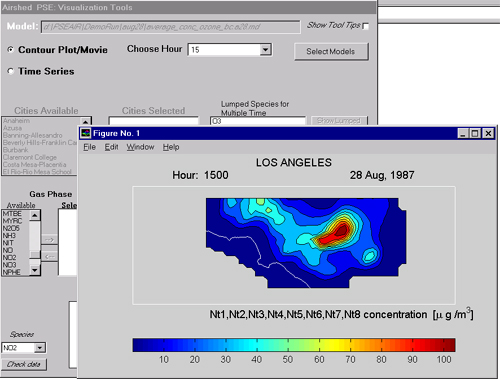
Intrinsic to the PSE Airshed is the contour plotting program to make the PSE self sustaining. However, if the user chooses to utilize Matlab for movies and professional contours, the user has that option. The postprocessing of the output to CIT Airshed processed by Matlab is done through the interface shown in the above figure.